
A Single Disability Policy Priced Its Premium Load from a Physical Therapy Visit Log

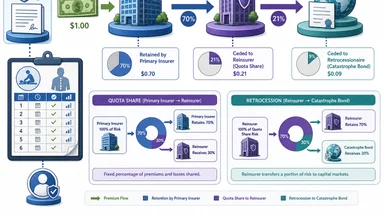
A mid-sized disability insurer quietly updated its underwriting guidelines. The change was not announced to policyholders and did not appear in marketing materials. It was a simple rule: if an applicant had attended 12 or more physical therapy sessions in the prior year, the base premium would carry a load of 15 to 25 percent. The decision turned a clinical record into a pricing signal. This article follows that premium dollar from the policyholder’s bank account to the reinsurer’s balance sheet, and explains what moves the load along the way.
The PT Log That Broke the Pricing Model
Disability insurers have long relied on morbidity tables—aggregate statistics that predict how often a given population will become disabled. The Society of Actuaries’ 2013 Individual Disability Experience Committee tables remain the industry standard. But these tables are backward-looking and pooled across many carriers. They do not capture individual behavioral signals such as physical therapy attendance.
The carrier that introduced the PT load analyzed its own block of business and found that policyholders with frequent PT visits filed claims at a rate roughly 40 percent higher than the baseline, according to a 2024 analysis by the actuarial firm Milliman. The signal was strongest for musculoskeletal conditions, which account for roughly a third of all disability claims. The underwriters reasoned that PT frequency indicated either a chronic condition or a propensity to seek treatment, both of which correlated with longer claim durations.
Not all carriers agree with this approach. Rival products still ignore PT data entirely, arguing that PT is often a preventive measure and that penalizing it could discourage healthy behavior. The discrepancy means that two identical applicants—same age, occupation, income—could see premium differences of hundreds of dollars per year depending on which carrier they choose. The PT load is not yet widespread, but it signals a broader shift toward individualized pricing based on medical utilization data.
The ethics of this practice are contested. Consumer advocates argue that using PT logs penalizes people who are proactive about their health. Insurers counter that they are simply pricing risk more accurately. The tension is unlikely to resolve soon, but the PT load is now a fact of the market for certain disability products.
Premium Flow: From Policyholder to Reinsurer
To understand why a PT load matters, it helps to trace where the premium dollar goes. For a typical individual disability policy, the gross premium is allocated roughly as follows: acquisition costs (commissions, underwriting, and issue) consume about 20 cents of every dollar. Claims and reserve funding take 60 to 70 cents. The remainder—10 to 20 cents—is the insurer’s expense load and profit margin. The PT load sits inside the claims and reserve piece, because it is meant to cover the expected higher claim costs.
But the primary carrier does not keep all of that premium. Through quota share treaties, the insurer cedes 30 to 50 percent of the premium to a reinsurer, along with a proportional share of the risk. The reinsurer, in turn, may retrocede the tail risk—the very long and expensive claims—to the capital markets via catastrophe bonds or insurance-linked securities (ILS). This layered structure means that the PT load ultimately flows to a mix of balance sheets.
For example, a policyholder paying a $2,000 annual premium with a 20 percent PT load contributes $400 specifically tied to the perceived risk of frequent therapy. Of that $400, perhaps $150 stays with the primary carrier, $200 goes to the reinsurer, and $50 is retroceded to an ILS fund. The exact splits vary by treaty, but the principle holds: the load is not a single company’s revenue; it is a signal that propagates through the entire risk-transfer chain.
This flow explains why reinsurers care about underwriting details like PT logs. A reinsurer that sees a block of business with heavy PT loads will price its own coverage accordingly, and may require the primary carrier to retain more risk or adjust its underwriting guidelines. The PT load thus becomes a negotiation point between primary and reinsurer, influencing the cost of capital for the entire product line.
What Moves the Load: Morbidity Tables vs. Real Data
The disability insurance industry has long relied on the Society of Actuaries’ 2013 Individual Disability Experience Committee (IDEC) tables. These tables are based on data from 2003 to 2009, and they aggregate experience across many carriers. They are static and smoothed, designed to be conservative rather than precise. The PT load represents a departure from this approach, using policy-level data to adjust the morbidity assumption.
Insurers that have access to electronic medical records (EMR) see a clearer picture. Some studies suggest that EMR-linked underwriting can identify claim rates 30 to 40 percent higher for certain conditions, compared with standard application data. But EMR access is limited by privacy laws such as HIPAA in the United States, and insurers cannot pool that data across carriers without violating antitrust rules. The result is a fragmented market where premium loads vary wildly for the same risk profile.
A 2024 analysis by the consulting firm Deloitte found that for a 40-year-old professional with a history of back pain, disability premiums ranged from $1,200 to $2,800 per year across 10 carriers. The PT load was a major driver of that variation. Carriers that used PT data charged more; those that ignored it charged less. The spread is not necessarily a sign of inefficiency—it reflects different risk appetites and data strategies.
The morbidity tables themselves are due for an update. The Society of Actuaries is working on a new study using data from 2015 to 2020, but the results are not expected until late 2026 or 2027. Until then, carriers will continue to supplement the tables with their own data, and the PT load will remain a point of differentiation.
Reinsurance Recoveries and the Cat Bond Connection
Disability tail risk—the possibility of a claim lasting 10, 20, or 30 years—is one of the hardest exposures to manage. Primary carriers often cede this tail to reinsurers, who in turn may transfer it to the capital markets. Catastrophe bonds, originally designed for property catastrophe risk, have increasingly been used for morbidity-linked exposures. In 2025, WoodStar Reciprocal Exchange raised $220 million through a structure arranged by Kilter Finance and Blue Owl Capital, as reported by Artemis.bm in an article titled "WoodStar Reciprocal Exchange Secures $220M Morbidity Cat Bond" (https://www.artemis.bm/news/woodstar-reciprocal-exchange-secures-220m-morbidity-cat-bond/). The bond’s trigger is based on a morbidity index, not on individual claims, which aligns investor returns with broad disability trends.
Nordic institutional allocators, according to a Markets Group commentary cited by Artemis.bm, are increasingly treating cat bonds as a complement to fixed income and alternatives. This demand creates a ready market for disability-linked securities, which in turn gives reinsurers more capacity to underwrite disability risk. The PT load, by signaling higher expected morbidity, influences the price at which that capacity is offered.
If a primary insurer loads premiums based on PT data, and that load is passed to the reinsurer, the reinsurer may price its coverage higher or demand a higher retention from the primary. In some cases, the reinsurer may refuse to cover the loaded risk altogether, forcing the primary to retain it or seek alternative capital. The cat bond market provides a backstop, but only if the morbidity index matches the carrier’s experience. Mismatches can lead to basis risk, where the bond does not pay out even though the carrier’s claims are high.
The connection between a PT log and a cat bond may seem distant, but it is direct: every premium load ultimately finds its way to a balance sheet somewhere in the risk-transfer chain. The price of that load depends on the availability and cost of reinsurance and ILS capacity, which in turn depends on investor appetite for morbidity risk.
Transactional Risk and the Fine Art Diversion
Disability insurance does not compete for capital in a vacuum. The same pools of reinsurance and ILS capacity are used for property, casualty, and specialty lines. In July 2026, DUAL Group launched a global Transactional Risk offering, backed by Liberty, covering warranty and indemnity, tax, contingent risk, and climate risk, as reported by ReinsuranceNe.ws (https://www.reinsurancene.ws/dual-group-launches-global-transactional-risk-offering/). Tokio Marine Highland named Casey Santangelo as President of Fine Art and Collectibles, as reported by ReinsuranceNe.ws (https://www.reinsurancene.ws/tokio-marine-highland-names-casey-santangelo-president-of-fine-art-and-collectibles/). These lines of business absorb capital that might otherwise support disability risk.
When capital is scarce—due to large property catastrophe losses or increased demand for transactional risk—reinsurers raise prices across the board. Disability carriers then face higher costs for their own reinsurance, which can lead to higher premium loads for policyholders. The PT load, which was already a response to perceived risk, may be amplified by broader market conditions.
The fine art and collectibles market, for example, has grown rapidly in recent years, attracting underwriting talent and capital. Tokio Marine Highland’s appointment of Santangelo signals a commitment to that niche. But every dollar allocated to fine art is a dollar not allocated to disability. The competition for capital is a structural feature of the insurance market, and it means that disability premiums are influenced by trends in entirely unrelated lines.
Risk managers should be aware that the price of their disability coverage is not determined solely by their own health profile. It is also shaped by the global supply of reinsurance capital, which ebbs and flows with events in other markets. A hurricane in Florida or a surge in transactional risk deals can indirectly raise disability premiums, even if the policyholder's risk has not changed.
Phantom Damages and the Third-Party Financing Effect
Third-party medical financing is a growing force in liability claims, as reported by Risk & Insurance in July 2026 in an article titled "The Rise of Third-Party Medical Financing and Its Impact on Claims" (https://riskandinsurance.com/the-rise-of-third-party-medical-financing/). These arrangements allow plaintiffs to obtain medical treatment without upfront payment, with the provider seeking reimbursement from a settlement or judgment. The effect is to inflate medical costs in liability cases, creating what are sometimes called “phantom damages.” While this phenomenon is most visible in auto and general liability, it has spillover effects on disability insurance.
Disability insurers see claims where the claimant has undergone expensive treatments financed by third parties. The cost of those treatments may be included in the disability claim, either directly or indirectly, through higher medical expenses that prolong the disability. The PT log, which captures only the frequency of therapy, does not capture the cost of that therapy if it is financed externally. Pricing models that rely on PT logs alone may miss this indirect morbidity.
The result is that loss triangles—the actuarial projections of future claim costs—become opaque. A disability block with heavy PT utilization may appear risky, but the true cost depends on whether those PT sessions are paid out of pocket, by health insurance, or by a third-party financier. The PT load, by itself, cannot distinguish among these scenarios. Carriers that use PT loads without adjusting for financing may overprice or underprice risk.
Risk managers should consider the broader medical financing environment when evaluating their disability coverage. A policyholder who uses third-party financing for PT may face a premium load that is not justified by the actual cost to the insurer, because the financing arrangement may reduce the insurer’s exposure. Conversely, a policyholder who pays out of pocket may be penalized even though their claims are cheaper. The interaction between PT logs and financing is a blind spot in current pricing models.
Practical Takeaways for Risk Managers
For risk managers evaluating disability coverage for their organizations or themselves, the PT load is a specific and actionable factor. First, audit your own physical therapy visit history before applying. If you have had 12 or more visits in the past year, be prepared for a potential premium load. Some carriers may waive the load if the therapy was for a one-time injury that has resolved, so documentation matters.
Second, some insurers are willing to exclude certain types of PT—such as post-surgical rehabilitation or maintenance therapy for chronic but stable conditions—if the underwriter is satisfied that the risk is low. This possibility is easier to explore if you have a clear medical record and a letter from your physician.
Third, compare quotes from carriers that use different data sources. Some carriers rely heavily on PT logs; others ignore them entirely. The spread in premiums can be substantial, and a carrier that does not use PT data may offer a better price for a history of frequent therapy. However, be aware that such carriers may also have less accurate pricing overall, which could lead to rate increases later.
Fourth, monitor reinsurer appetite shifts through publications like Artemis.bm and ReinsuranceNe.ws. When reinsurers pull back from disability risk, primary carriers tend to raise premiums across the board. Timing your application to avoid such cycles can save money. Finally, consider a captive or self-insured retention for low-risk groups. If your organization has a healthy workforce with low PT utilization, self-funding the first layer of disability risk may be cheaper than buying fully insured coverage with a PT load built in.
These recommendations come with caveats. The PT load is based on correlations, not causation, and its predictive power may weaken as more policyholders become aware of it and alter their behavior. Moreover, the advice to compare carriers assumes that the policyholder has access to multiple quotes and the time to evaluate them—a luxury not always available in group or employer-sponsored plans. Finally, the PT load is just one of many factors; a carrier that ignores PT data may compensate with other conservative assumptions. Risk managers should weigh the trade-offs carefully.
This article is for informational purposes only and does not constitute personalized insurance, legal, or medical advice. Coverage terms and pricing vary by carrier and jurisdiction. Consult a qualified insurance professional for advice tailored to your situation.