Excess Layers Priced a Single D&O Tower Using Three Different Reinsurance Curves

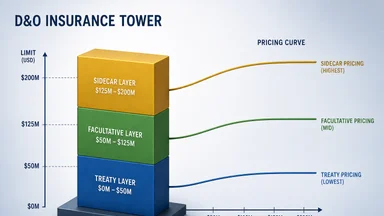
A directors and officers liability tower is rarely a single, homogeneous block of coverage. In a typical $50 million program, the first $10 million may be ceded under a treaty reinsurance agreement, the next $15 million placed facultatively, and the top $25 million structured as a sidecar. Each mechanism uses a different pricing curve, creating hidden seams where coverage gaps, pricing misalignments, and arbitration conflicts can emerge. A 2022 analysis by the insurance broker Aon noted that multi-layered D&O towers with mixed reinsurance structures are increasingly common, particularly for publicly traded companies with market capitalizations above $5 billion. Understanding how these curves interact is essential for risk managers who want to avoid surprises when a claim lands.
One D&O Tower, Three Reinsurance Curves
Consider a hypothetical $50 million D&O tower placed in the current market. The first $10 million is typically ceded under a treaty reinsurance agreement, which pools the risk with many other policies and relies on broad actuarial models. The next $15 million—layers from $10 million to $25 million—is often placed facultatively, meaning each risk is individually underwritten by a reinsurer. The top $25 million to $50 million may be structured as a sidecar, a collateralized reinsurance vehicle that behaves more like a catastrophe bond than traditional reinsurance. Each of these layers uses a different pricing curve because the underlying risk profile, loss experience, and capital cost differ dramatically.
The treaty curve is built on pooled frequency assumptions and standard loss development factors. The facultative curve reflects a bespoke assessment of the specific insured's risk, including industry exposures and litigation trends. The sidecar curve is driven by investor return expectations, often benchmarked against catastrophe bond indices. Combining these curves in a single tower creates a complex interplay where the same loss can be priced, reserved, and recovered differently depending on which layer it attaches.
This layering is not unusual. Many large D&O programs employ a mix of treaty and facultative reinsurance, and sidecars have become more common for excess layers above $25 million. But the pricing logic behind each curve is rarely disclosed to the policyholder, who sees only a blended premium. The risk manager may assume the entire tower is priced consistently, but the underlying reality is far more fragmented.
Why the Treaty Curve Underprices the Base Layer
The treaty curve is designed for frequency, not severity. It aggregates thousands of policies across many lines and relies on the law of large numbers to predict losses. For the first $10 million of a D&O tower, this works reasonably well for routine claims—shareholder suits that settle for a few million dollars, or regulatory actions with moderate fines. But the treaty curve systematically underweights tail risk: the rare but severe securities class action that can exhaust the primary layer and push into excess layers.
Standard industry loss warranties attached to treaty reinsurance often have attachment points that are too low to capture the full severity of a large D&O claim. For example, a typical ILW might trigger at $5 million of loss, but a catastrophic event—say, a merger objection lawsuit with a billion-dollar settlement—can blow past that attachment in days. The treaty curve assumes such events are outliers, but in the D&O line, tail risk is not a theoretical concept; it is a recurring reality. According to a 2023 report by the actuarial firm Milliman, the top 10% of securities class actions account for over 80% of total settlement dollars, a skew that the treaty curve often fails to capture.
As a result, the carrier writing the primary layer may be subsidizing the cost of that coverage. The treaty premium is set to cover the average loss frequency, but the actual exposure to severe events is higher than the curve implies. This underpricing is passed down to the insured as a lower premium for the base layer, which can be misleading. The risk manager might think the first $10 million is cheap relative to excess layers, but that cheapness masks a hidden subsidy from the carrier's capital.
Some actuaries argue that the treaty curve can be adjusted using loading factors for tail risk, but in practice, these adjustments are rarely sufficient. The competitive pressure to keep primary layer premiums low means that treaty curves are often cut to the bone. The result is a base layer that is priced for frequency but exposed to severity—a mismatch that becomes apparent only when a large claim hits.
The Facultative Curve: Bespoke Pricing for Tail Risk
Above the treaty layer, facultative reinsurance takes over with a fundamentally different pricing approach. Each risk is individually underwritten, and the rate is determined by the specific insured's loss history, industry sector, corporate governance practices, and litigation environment. A facultative underwriter might scrutinize the company's D&O claims history, its stock volatility, and even the jurisdiction where it is incorporated. The pricing curve here is steeper and more volatile because it reflects the idiosyncratic risk of the named insured.
Rate-on-line for facultative D&O layers typically ranges from 12% to 15% of limit, though this can vary widely. For a $10 million excess layer, that translates to $1.2 million to $1.5 million in premium—significantly more expensive than the treaty layer on a per-dollar basis. The higher price is justified by the fact that excess layers are more likely to be hit by the tail events that the treaty curve ignores. A securities class action that settles for $50 million will exhaust the primary layer and attach the facultative layers, making them the true risk-bearing part of the tower.
Facultative reinsurers also have more flexibility in structuring terms. They can exclude certain risks, impose aggregate limits, or require specific loss prevention measures. This bespoke underwriting means that the facultative curve is not a single curve but a family of curves, each tailored to the risk. For risk managers, this creates a challenge: the pricing of the facultative layer can change dramatically from year to year, depending on market conditions and the insured's own loss experience.
One important feature of facultative reinsurance is the use of individual loss modeling. Some brokers, such as Willis Towers Watson, offer stochastic modeling tools that simulate thousands of D&O loss scenarios to derive a price. These models incorporate tail correlations that the treaty curve misses, but they are only as good as the assumptions about frequency and severity. A model that underestimates the probability of a mega-suit will produce a curve that is too flat, exposing the reinsurer to underpriced risk.
Sidecar Pricing: A Third Curve No One Talks About
The sidecar structure is the least understood of the three curves. A sidecar is a special-purpose reinsurance vehicle that issues notes to investors, who receive a return based on the loss experience of the reinsured portfolio. For D&O, sidecars are typically used for the highest excess layers—above $25 million or $50 million—where the risk is remote but the potential severity is enormous. The pricing curve here is not actuarial but capital-market-driven.
Investors in a D&O sidecar expect a spread that compensates them for the risk of losing principal. That spread is benchmarked against catastrophe bond indices, which historically have offered yields of 5% to 10% above LIBOR. For a $25 million layer, the premium might be $2 million to $3 million, implying a rate-on-line of 8% to 12%. But the key difference is that the sidecar's capital is fully collateralized, meaning the investors' money is held in trust and is at risk if claims exceed a certain threshold.
The sidecar curve is driven by investor appetite, not by actuarial loss projections. If the catastrophe bond market is hot, sidecar pricing may tighten, even if D&O loss trends are worsening. Conversely, a flight to quality can cause sidecar spreads to widen, making the top layer of the tower suddenly more expensive. This disconnect between the sidecar curve and the underlying risk creates a potential misalignment: the price of the top layer may have little correlation with the actual probability of a claim attaching there.
For risk managers, the sidecar layer is often opaque. The policyholder may not even know that the top layer is supported by a sidecar, as the structure is typically disclosed only to the carrier and regulators. But the implications are clear: if the sidecar's investors demand a higher spread, the premium for the top layer will rise, potentially making the entire tower uneconomical. Some carriers have responded by retaining more risk on their own balance sheets rather than ceding to a sidecar at unfavorable terms.
How These Curves Interact in a Single Tower
When a loss occurs, the interaction between the three curves becomes critical. Consider a $50 million securities class action settlement that is allocated across the tower. The first $10 million is paid by the treaty layer, which may have a different definition of loss and a different claims-handling process than the facultative layers above. The treaty reinsurer might dispute the allocation of defense costs, arguing that certain expenses should be attributed to the excess layers. Disputes over loss allocation are common and can delay recovery.
The facultative layers, covering $10 million to $25 million, are typically excess of the treaty layer. But the attachment point may be defined differently: the treaty layer might attach on a "loss occurring" basis, while the facultative layer attaches on a "claims made" basis. If the claim straddles policy periods, the allocation can become a nightmare. Each layer may have its own arbitration clause, and the arbitration panels may reach conflicting decisions about how much of the loss belongs to which layer.
The sidecar layer, sitting above $25 million, is the most remote. It is often structured as a "top and drop" or in a vertical slice, meaning it shares proportionally in the loss once the underlying layers are exhausted. But the sidecar's collateral trust may have specific investment guidelines that affect the timing of payouts. If the sidecar's assets are in illiquid investments, the recovery may be delayed, creating a cash-flow strain for the carrier.
One practical consequence is that the same claim can be treated differently by each reinsurer. The treaty reinsurer may reserve conservatively, the facultative reinsurer may reserve aggressively, and the sidecar may reserve based on market expectations. The carrier, caught in the middle, must reconcile these different approaches, often leading to a higher overall reserve than any single curve would suggest. This "reserve stacking" can inflate the carrier's loss ratio and reduce its willingness to write D&O in the future.
The Hidden Cost of Curve Misalignment
When the three curves are out of alignment, the most visible cost is the gap in attachment. If the treaty layer has an attachment point of $10 million but the facultative layer attaches at $12 million, there is a $2 million gap that the carrier must retain. This gap can arise from differences in definitions of "loss" or "claim." For example, the treaty might define loss as indemnity only, while the facultative layer includes defense costs. If defense costs push the treaty layer's payout above $10 million, the facultative layer may not respond until the loss exceeds $12 million inclusive of defense costs.
Disputes over loss allocation are another hidden cost. A 2021 study by the International Association of Insurance Supervisors found that allocation disputes account for approximately 15% of all D&O-related litigation between carriers and reinsurers. When the curves are misaligned, the carrier may end up retaining a larger share of the loss than it anticipated, eroding the benefit of reinsurance. In extreme cases, the carrier may face a "vertical" gap where no reinsurer pays, leaving the entire layer uninsured.
Arbitration clauses vary by layer, adding another layer of complexity. The treaty might require arbitration in London under English law, while the facultative layer specifies New York law. The sidecar may use a different forum altogether. When a dispute involves multiple layers, the carrier must navigate multiple arbitration proceedings, each with its own rules and timelines. This can multiply legal costs and delay resolution by years.
The cumulative effect of these misalignments is that the carrier's actual retained loss can be significantly higher than the modeled expectation. For risk managers, this means that the premium they pay may not reflect the true cost of risk transfer. A tower that appears well-structured on paper may have hidden seams that only become apparent when a claim tests the boundaries between curves.
Practical Takeaways for Risk Managers
Risk managers can take several steps to mitigate the risks of curve misalignment. First, request a curve-specific pricing breakdown from the broker. Ask for the premium allocated to each layer and the underlying reinsurance mechanism. If the carrier is unwilling to provide this detail, that is a red flag. Understanding how each layer is priced helps the risk manager evaluate whether the tower is overpriced or underpriced relative to the risk.
Second, evaluate the collateral quality of the reinsurers supporting each layer. Treaty reinsurers often have lower collateral requirements than facultative reinsurers, and sidecar investors may post cash or high-grade bonds. If a reinsurer is thinly capitalized, the risk of non-payment increases. For a large D&O claim, a reinsurer insolvency can leave the carrier holding the bag, which ultimately affects the policyholder's recovery.
Third, stress-test the tower under different tail scenarios. Work with the broker to model what happens if a $100 million class action settlement attaches the tower. How much of the loss falls on each layer? Are there gaps? Are the arbitration clauses consistent? A simple "what if" table can reveal surprising gaps that the standard pricing model ignores.
Finally, negotiate a single arbitration clause for the entire tower. While this may be difficult to achieve in practice, having a unified dispute resolution process can prevent the multi-forum nightmare that arises when layers conflict. Some large commercial policyholders have successfully inserted a "tower-wide" arbitration provision in their manuscript policies, and it is worth pushing for. The cost of a single arbitration is far less than the cost of multiple, inconsistent proceedings.
These steps will not eliminate the complexity of a multi-curve D&O tower, but they can help the risk manager see the hidden seams before they become costly surprises. The insurance market is unlikely to simplify anytime soon, but informed buyers can at least understand what they are purchasing—and what they are not. However, these strategies come with trade-offs. Requesting granular pricing data may strain broker relationships, and negotiating a single arbitration clause often requires significant bargaining power that smaller policyholders lack. Moreover, stress-testing relies on assumptions that may not hold in extreme market conditions. Ultimately, no amount of diligence can fully eliminate the structural risks embedded in these towers; the best a risk manager can do is to weigh the cost of complexity against the benefit of coverage.